

The Career Stats That Drive Long-Term Baseball Card Values
Posted by Jody Bossert on 2nd Oct 2025
There has been a ton of chatter on social media comparing Cal Raleigh and Aaron Judge in the 2025 MVP race. When the conversation first began, Cal had the edge in Home Runs and Runs Batted In, but Judge owned every other category if I recall, including Batting Average and Wins Above Replacement. It got me thinking about which stats people favor most when considering an MVP or if there are other external factors, such as playing in a major media market or specific impact on a team, that play a factor.
The argument drove a frenzy on social media, prompting me to take a step further into my industry of sports collectibles. I wondered if there were certain stats that make a player’s cards and collectibles shine above their peers in value. There are obviously other factors, such as rarity and cultural storylines, that need to be considered, but for this blog post I thought it would be interesting to focus on player stats.
I mean, if I were speculating and had the option to purchase the card of either a power hitter like Cal Raleigh or a strong batting average hitter like Aaron Judge, which one would be most likely to increase in value? (For the record, I can barely hold a straight face calling Aaron Judge a batting average hitter and not a power hitter, but work with me here. I’m simply interested to know if any stats stick out to indicate a player’s long term card value.)
To test this I decided to look at the top 100 baseball players of all time and compare their stats with their card values. Now is this the best strategy? Am I a certified baseball statistician? Well, no, but we're just having fun here. Hey, I was the official scorekeeper for the Washington Huskies baseball team a few years ago, if that gives me any statistics street cred.
The Process
STEP ONE
To start, I needed to identify the top 100 players. While I could simply throw out my own opinions on that, as a “homer” for Seattle sports it would probably contain far too many Mariners. (Yes, Felix Hernandez should be on the list, but he’s not even a lock for the HOF because his career was defined by never getting any run support! …but I digress.)
To compile my impartial list I did a Google search and tracked the average rank of players from the following five reputable Top 100 lists published since 2000:
- ESPN
https://www.espn.com/mlb/story/_/id/33145121/top-100-mlb-players-all - The Baseball Scholar
https://thebaseballscholar.com/2019/06/12/100-greatest-baseball-players-of-all-time/ - Baseball Egg
https://baseballegg.com/comparing-baseball-all-time-top-100-lists/ - The Athletic
https://www.nytimes.com/athletic/tag/the-baseball-100/ - Ranker
https://www.ranker.com/crowdranked-list/the-greatest-baseball-players-of-all-time
(If a player was in one list, but not in another list’s top 100, I set their rank at 101 when calculating their average position among the five lists.)
STEP TWO
With this list in hand, notably featuring nine currently active players, I submitted it to ChatGPT along with the following prompt:
“Take this list of what I believe are the 100 greatest baseball players of all time and rank them based on how valuable their trading cards tend to be on average.”
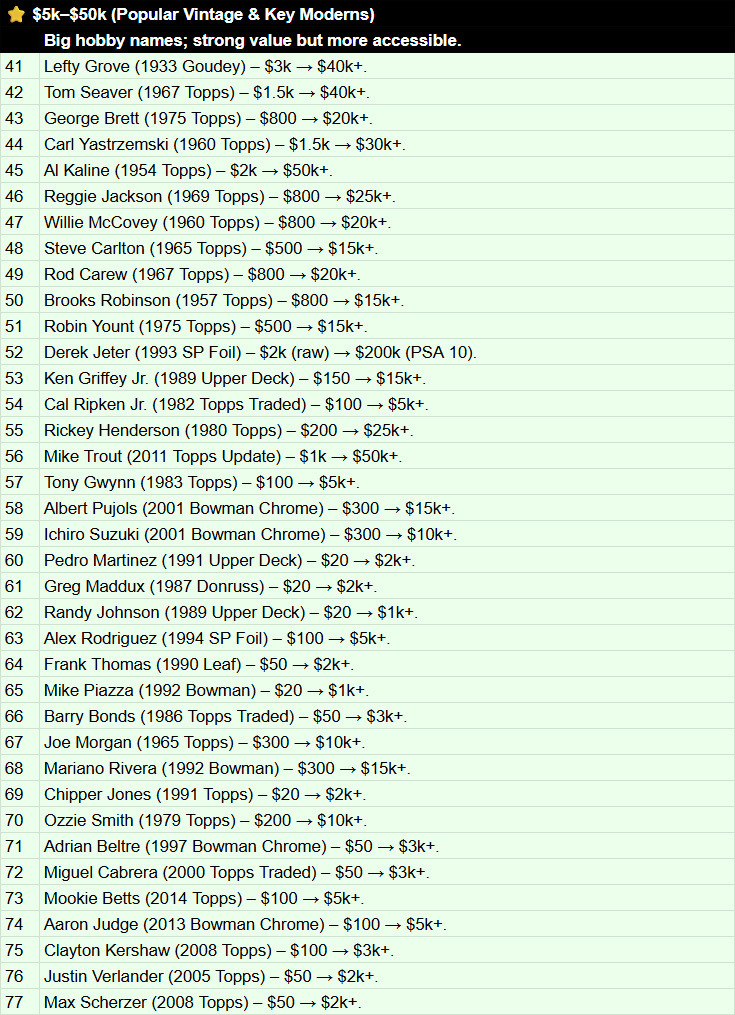
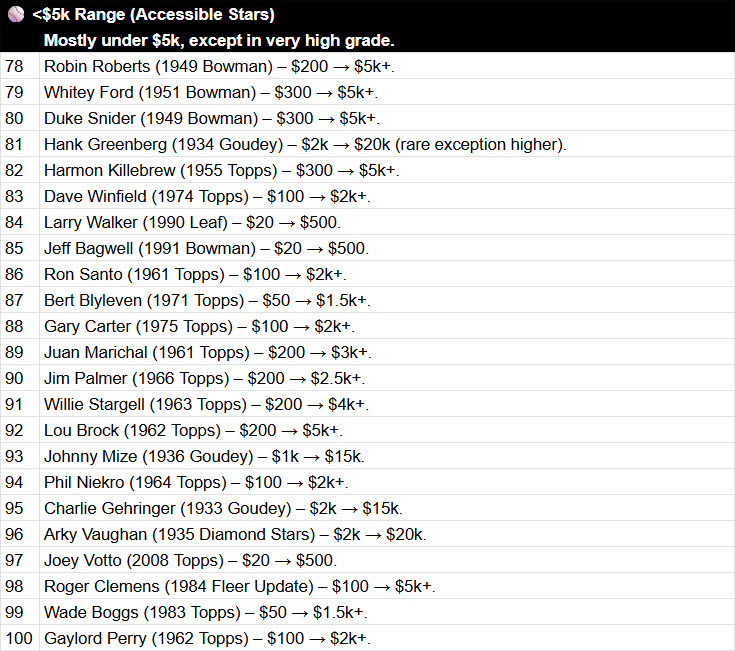
I now had my list of the top 100 players ordered by the value of their cards:
STEP THREE
Now I just needed to plug in their game stats and observe trends in the charts. For chart creation, I utilized AI jumping between ChatGPT and Gemini as my daily credits expired.
But first…
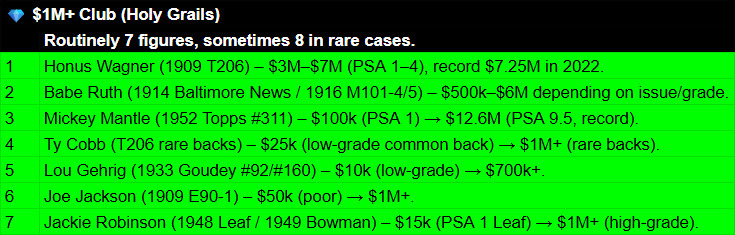
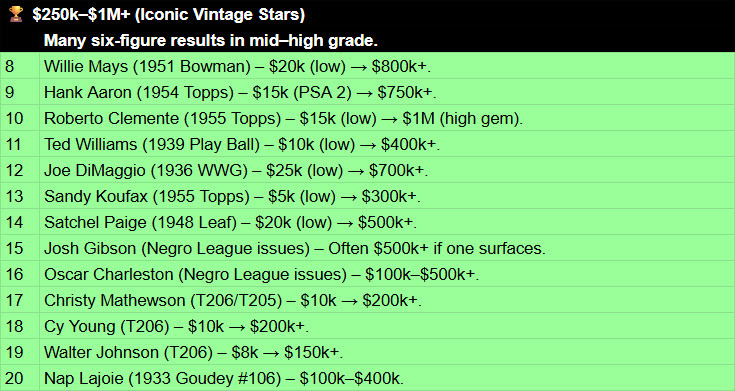
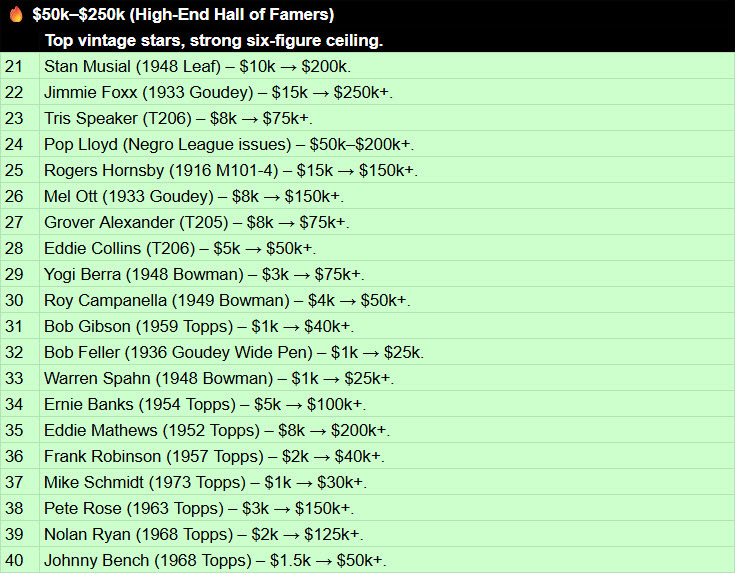
Which Era Sees the Greatest Flow of Money
I thought it would be interesting to see a bar chart of the list based on the era to see where money in the hobby is flowing.
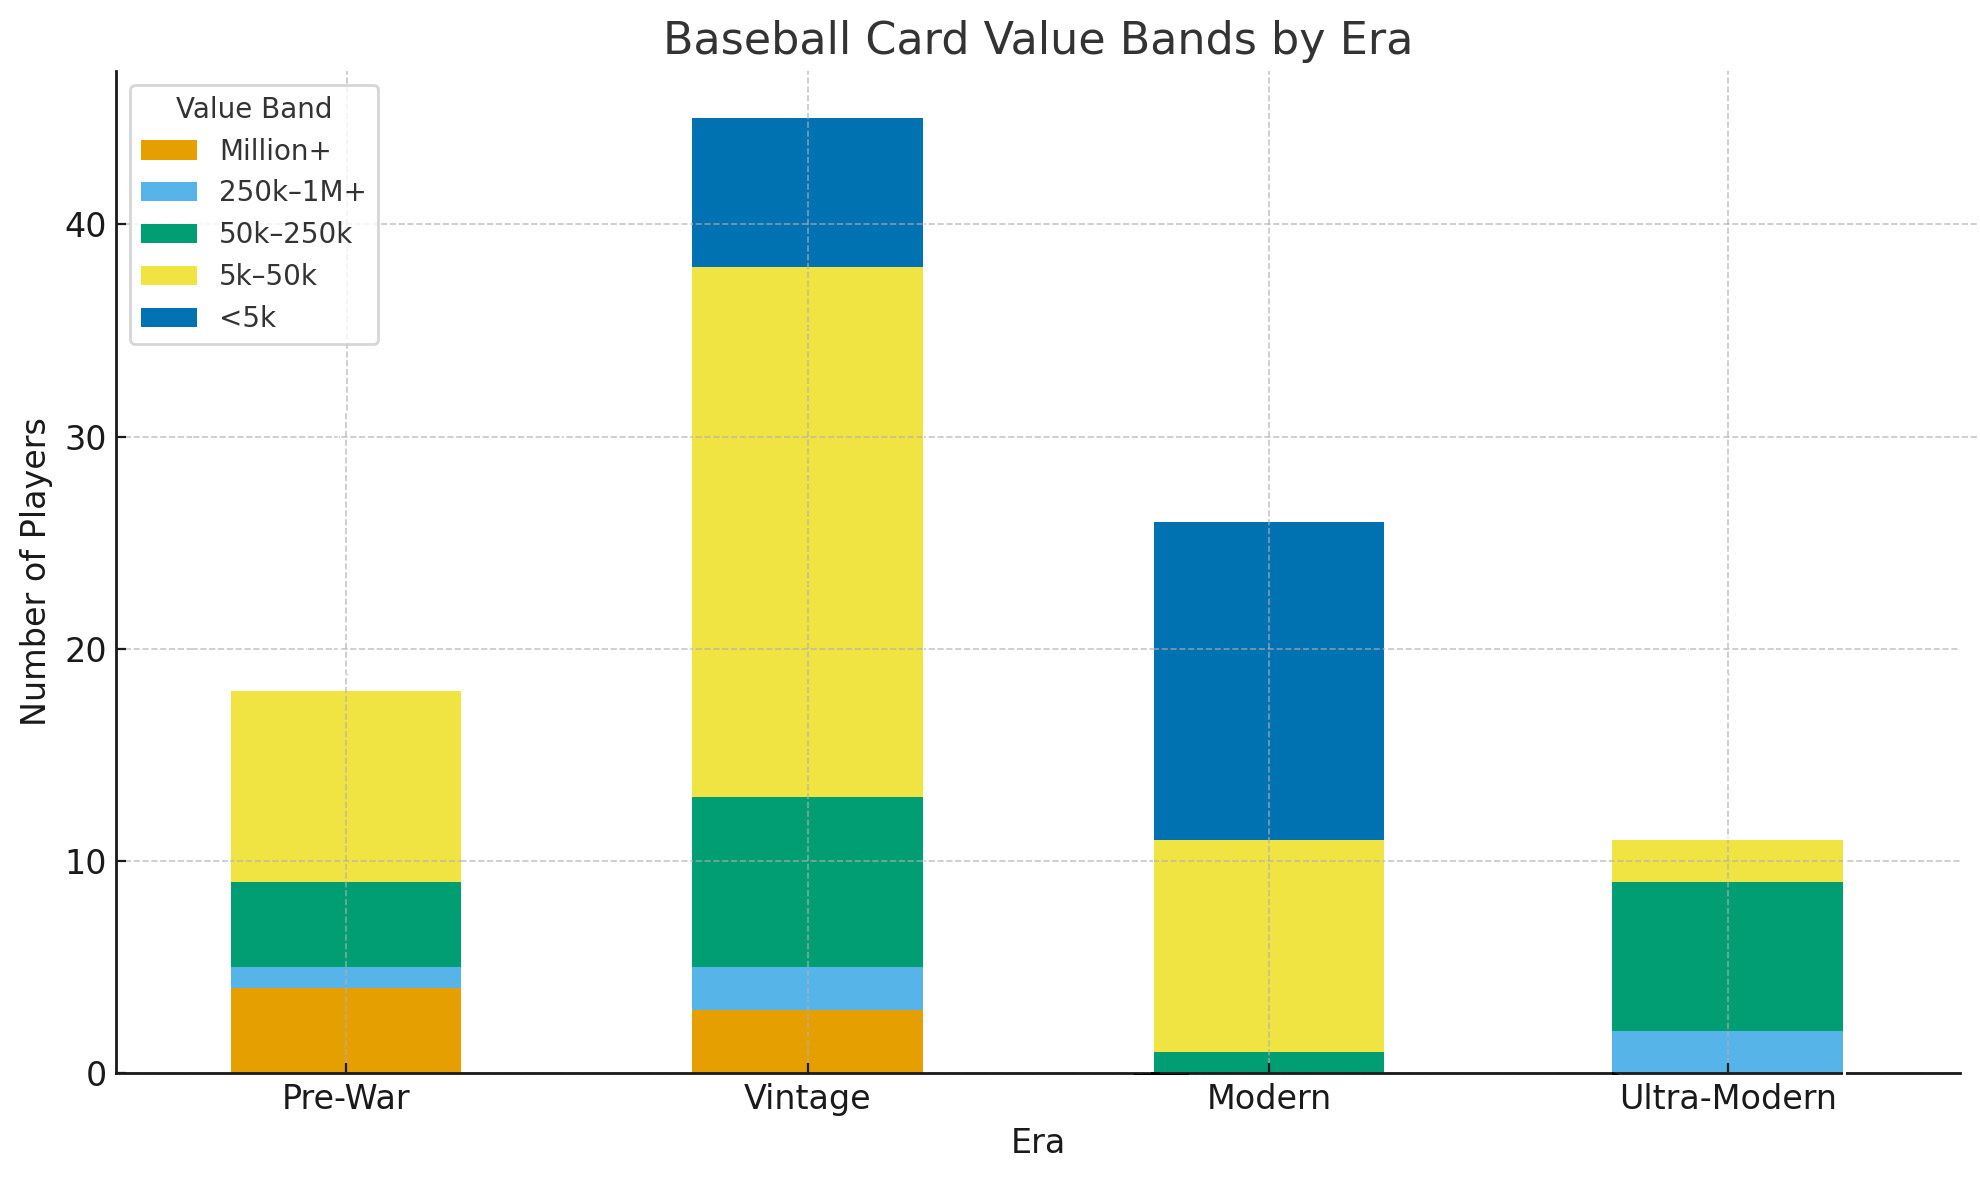
As expected, most of the money is spent in the Vintage era where rarity increases the value, but cards aren’t so incredibly rare that they can’t keep the market pumping.
Now with the final spreadsheet laid out in front of me - my top 100 list sorted by each player’s card value rank along with their career stats - I’m able to start playing with the numbers to observe some trends.
The Card Values of Position Players Vs. Pitchers
The first thing I want to test at a glance is the notion that position players’ cards tend to outpace those of pitchers.
Some players, especially in the early years, were primarily position players but did put in some innings on the mound (ie. Wagner, Cobb, Charleston), so I’m not considering any player with pitching stats of fewer than 100 innings pitched. With that in mind, here are the number of pitchers appearing in each quarter of the list:
- Rank 1-25: 6 Pitchers
- Rank 26-50: 8 Pitchers
- Rank 51-75: 5 Pitchers
- Rank 76-100: 10 Pitchers
Considering that there are 14 pitchers in the top half of the list and 15 pitchers in the bottom half, it seems the value of pitchers’ cards are fairly even with those of position players. Therefore, when it comes to the myth that position players cards outpace pitchers in value, I think we can consider that myth busted!
Pitcher Stats
I sorted all of the pitchers with at least 100 innings pitched (29 results) and Babe Ruth topped the card value list while having the fewest innings pitched at 1221.1. Makes sense since he is most remembered for his bat. Mariano Rivera (68th overall) is a close second in innings with 1283.2. Again, makes sense since he mainly worked limited innings as a closer.
As we look to see which career pitching stats are most coveted among card collectors, we’ll be comparing the top 29 pitchers in terms of average card value with regards to five stats: WPCT, ERA, IP, K, and WHIP.
Does Win/Loss Percentage (WPCT) Drive Card Value?
![]()
With 29 results, Bob Feller owns the median at 0.621%, so let’s remove him to give us an even split of the top 14 and bottom 14.
In the top 14 (Ruth through Carlton), we can see 5 players above the line and a combined average of .618. In the bottom 14 (Martinez-Perry) there are 9 players above the line and those 14 have a combined average of .618.
What did we learn?
Absolutely nothing! But we had fun, right?
There is only room in our collective memories to drive card value for a select number of elite pitchers though, so I suspect those names just mentioned in the bottom half will be replaced over time. They’ll surely be replaced by other more recent elite arms, so the volatility we see in the bottom half will probably remain consistent.
Okay, we learned a little. It is interesting to note how the top half of the list are more vintage players and a little more consistent in their numbers. There are more recent players in the bottom half, including some of the biggest numbers from guys like Martinez, Kershaw, Scherzer, and Clemens.
Ultimately, I think a larger dataset is needed, but again, there is little room in our collective memories to increase the number of “must have” cards that make up the top quarter of the list, so maybe not. I guess if we want to take something from this, we could use that .621 figure as a benchmark and then only collect cards of pitchers above that line who also have other personal stories or standout stats that may make them relevant over a longer period.
For instance, Nolan Ryan is on the edge of the top 10, but not because of his Win-Loss % which is the lowest on the list, but rather due to his longevity among other things. Were his Win-Loss% over .621, I think we can assume that he’d crack the top 10.
Does Earned Run Average (ERA) Drive Card Value?
![]()
Pedro Martinez owns the median here giving up an average of 2.93 runs per game. Nine pitchers in the top 14 have better ERAs while the bottom 14 has only five. Plus, the highest ERAs (Verlander, Roberts, Blyleven, and Niekro) are all found in the bottom half.
What did we learn?
These numbers start to hint that a low ERA should be considered when choosing which pitcher cards to collect, but again, I’m ultimately learning that a larger dataset would be helpful.
Does Innings Pitched (IP) Drive Card Value?
![]()
Randy Johnson sets the median here at 4135.1 innings pitched. The top 14 features eight pitchers above that line with the bottom 14 showing six.
What did we learn?
Those eight and six stats are pretty close, but at a glance it sure looks like more innings - which probably indicates a longer career - can nudge card values higher. A larger dataset would help. Wait, did I already mention that?
Do Strikeouts (K) Drive Card Value?
![]()
 With regards to strikeouts, Clayton Kershaw owns the middle of the list with 3026. Five of the top 14 have more than him while there are nine with more in the bottom half.
Nolan Ryan’s 5714 Ks are light years beyond everyone else, so I think we can see what has carried him into the top half of the list, making up for his list-leading low WPCT. Joining him at the top and towering above the rest are Randy Johnson and Roger Clemens. All three carried a devastating fastball in their arsenal.
What did we learn?
Once again we are seeing stats that favor the bottom half of the list where we also tend to see more volatility. I think people are attracted to power, so it’s not surprising to see those arms represented here. Let’s be honest though, the longer your career is, the more strikeouts you’re going to have the opportunity to accumulate. A better chart here would’ve been their strikeout percentage. I don’t have that data handy, but this next data point is pretty darn close.
Does Walks and Hits Per Innings Pitched (WHIP) Drive Card Value?
![]()
At the top of the list we’ve got Babe Ruth setting the median here at 1.16 combined walks and hits per inning. From there we’re split with seven pitchers in the top half and seven in the bottom half with lower WHIPs.
Mariano Rivera leads the list with an impressive 1.00 WHIP, however he was a closer. Not to take anything away from his incredible career, but closers are more expected to run like Top Fuel dragsters in short bursts of next-level awesomeness.
What did we learn?
Good question. As this is the final chart we’re looking at for pitchers, I think it’s fitting that the player at the top sets the median. Why? Because I don’t know that we’ve truly learned anything from these charts that would lead me to believe that any particular statistic should carry more weight than any other when choosing which current pitcher’s cards to buy as a long term investment. I was hoping to see more of a slope in these charts, but no dice.
That said, I DO think it’s a worthy topic to research. I just think we’ve learned that we need a much larger dataset. Hopefully we’ll have better luck looking at the much longer list of position players in the top 100, though I suspect we’ll still need to jump to some conclusions.
Position Player Stats
Let’s now take a look at the stats of the top position players. Identifying those within the top 100 who make up this list is a bit trickier as many of the pitchers were also hitters, but their hitting skills are rarely what drives their card value.
Greg Maddux played a staggering 22 years, all in the National League where pitchers hit, and accumulated 1591 at bats. So let’s just nudge that up a bit and include all players with at least 2000 plate appearances.
Nope! Negro Leagues star Pop Lloyd never pitched and only had 1615 plate appearances so let's go with 1600.
That gives us 78 players with Babe Ruth, Christy Mathewson, Cy Young, Walter Johnson, Grover Alexander, Warren Spahn, and Steve Carlton appearing in both lists as we, once again, track five stats: H, HR, RBI, AVG, and OPS.
Does Batting Average (AVG) Drive Card Value?
![]()
With this many players the names on the charts are a bit harder to read, but it’s doable. Our batting average chart has Al Kaline and Jeff Bagwell sharing the median at .297. The top 39 have 24 players with a more impressive AVG than theirs, while the bottom half has 15 above the .297 mark.
 Now the numbers are starting to speak a little more. The top half of the list has a nine player advantage over the bottom half and, at a glance, those batting averages in the top seem to spike much higher than those in the bottom half. Ruth, Cobb, Gehrig, Jackson, Williams, Gibson, Charleston, Lajoie, Speaker, Lloyd, and Hornsby all posted a higher AVG than Gwynn’s bottom half-leading .338.
Also, Mathewson, Young, Johnson, Alexander, and Spahn all made the top 100 for their pitching and really lower the curve in the top half while the same can only be said for Steve Carlton in the bottom half. Even with those low numbers in the top, the average averages still stand out (haha, “average averages”).
What did we learn?
It’s probably safe to say that early 1900’s pitching doesn’t compare to today’s pitching. That said, I don’t necessarily think that should diminish the significance of a player’s lifetime batting average with regards to its influence on the value of a player’s cards. Therefore, AVG seems like a great stat to consider when identifying a current player’s long term card value.
Do Hits (H) Drive Card Value?
![]()
Once again, with a list that totals an even number, the median is the average of the two in the middle: Hank Greenberg (2,611) and Harmon Killebrew (2,619). That puts it at 2,615 hits with 20 players above that mark in the top half and 19 above it in the bottom half.
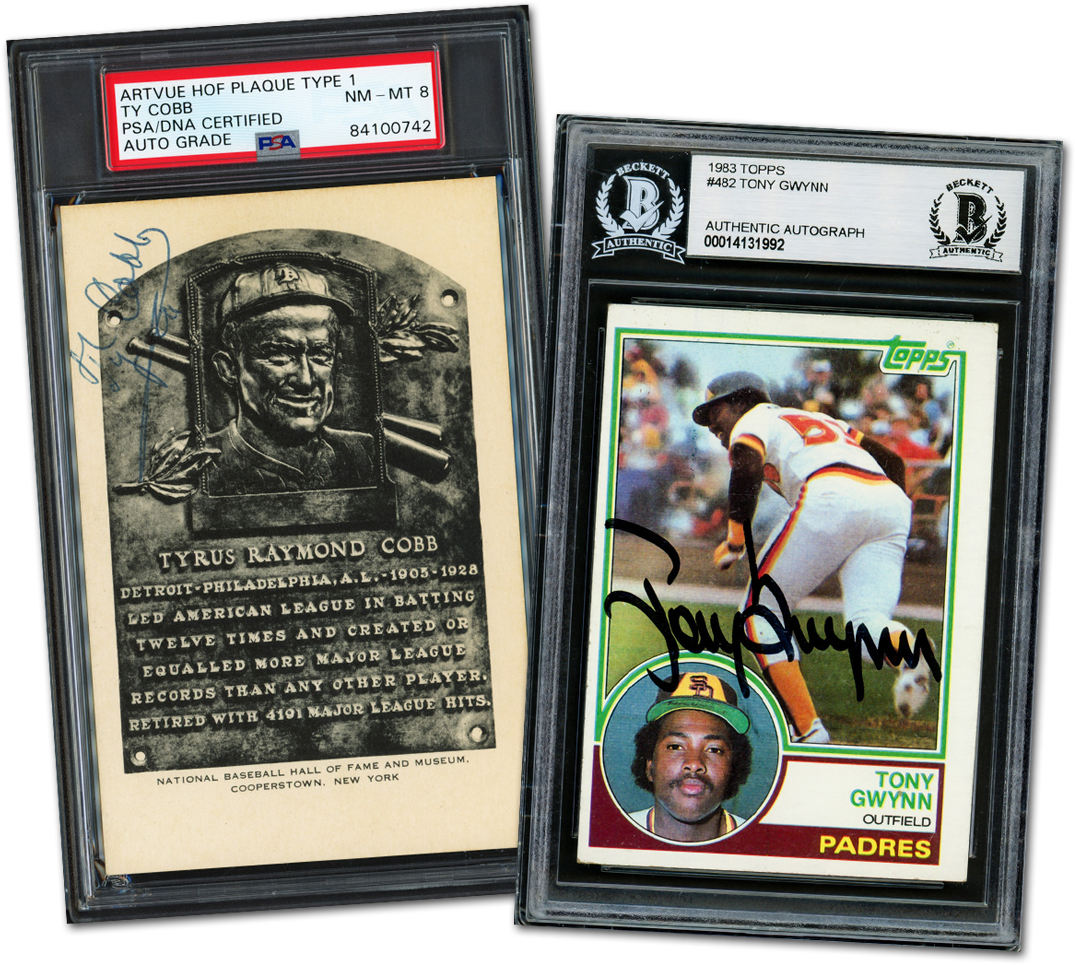
 Standing out among the crowd are Ty Cobb at 4,191 and Pete Rose at 4,256. Plus, Ichiro sits at 3,089, but ultimately has 4,367 if we include his nine years playing in Japan prior to the MLB.
What did we learn?
I would say this stat is a driving factor behind the card values of those three players, however I have a hard time looking too deeply at stats that display total numbers. I’m more inclined to favor stats that represent averages or percentages because players who have a longer career, for example, will most likely have more hits. That doesn’t necessarily mean they are better hitters than anyone else. (That said, I’m a Seattle “homer” as previously mentioned, and will gladly confirm that Ichiro was and always will be a better hitter than anyone else.)
Do Home Runs (HR) Drive Card Value?
![]()
Aaron Judge and Joey Votto share the median here at 356 HRs. Once again we have an even spread with 19 players in each of the top and bottom halves of the list.
We all remember the 1999 Nike commercial “Chicks Dig the Long Ball” with Tom Glavine and Greg Maddux. I think it extends far beyond that though. EVERYONE digs the long ball. HRs are the most exciting play in baseball. We love to witness them. We love to talk about them. They affect the outcome of the game more than any other play.
Just for grins and giggles I added up the HRs of those 19 mentioned above to reveal 9,879 in the top half and 9,656 in the bottom for an edge in the top half of…(drum roll please)...223. While that might not seem like many, that’s almost an additional 18 year career (see Clemente). Plus, let’s be honest, Barry Bonds leads the way with 762 and would surely be in the top half if it weren’t for the controversy surrounding his career. We also need to consider the early-era pitchers in the top half skewing the results.
What did we learn?
While stats surely influence card sales, it’s a player’s popularity that truly drives their cards’ value and home runs are simply the one stat that drives more baseball conversations than any other. Therefore, it only makes sense that we see more HRs in the top half of the list.
Does On-base Plus Slugging (OPS) Drive Card Value?
![]()
Eddie Matthews and Harmon Killebrew share the OPS median at .885. 19 players are above the median in the top half and 18 in the bottom, so a fairly even split. If we average it out though, we see .996 at the top and .947 at the bottom. That’s a pretty significant difference largely driven by Ruth, Gehrig, Williams, J. Gibson, and Charleston who all exceed Bonds’ 1.051.
What did we learn?
A strong OPS seems to be a fairly good indicator of a player whose cards will have long-term value.
Do Runs Batted In (RBI) Drive Card Value?
![]()
The median here splits Robin Yount (1,406) and Charlie Gehringer (1,427) at 1,416 RBIs. Just as we saw in the AVG chart, we have 24 players driving in more runs than the median in the top half compared to only 15 in the bottom half.
That said, I could be wrong, but I feel like we are seeing a little more consistency throughout when you remove some of the pitchers (ie. Mathewson, Johnson) and short career (ie. Lloyd, Jackson) players. Of course, you’ve also got guys whose numbers are low, but they hit near the top of the order with fewer chances for RBIs (ie. Ichiro, Smith).
What did we learn?
I’d say elite RBI stats probably aren’t a guarantee of card value, but are definitely worth considering.
Both Pitcher and Position Player Stats
Does Years Played Drive Card Value?
![]()
(Does not include current players.)
The median of 20 is shared by Foxx, Alexander, Seaver, Yount, Jeter, and Gwynn. With current players removed, there are 94 names, 47 in each half. There are 23 above the median in the top half and 20 above in the bottom half.
What did we learn?
This chart doesn’t readily indicate any trends, but we can assert that a 20 year career is a good indicator of a player who captured the eyes of two generations on the field and, therefore, doubled their opportunity to earn Public Sentiment, which we’ll look at later. This stat is irrelevant when deciding whether or not to invest in a current player’s cards, however longevity is largely based on game stats. So if their stats are elite, then they will probably have a long career (injuries aside of course).
Does Wins Above Replacement (WAR) Drive Card Value?
This stat wasn’t on my radar to begin with as I originally copied the stat line from the top of each player’s page at MLB.com (see Josh Gibson here) and WAR wasn’t included.
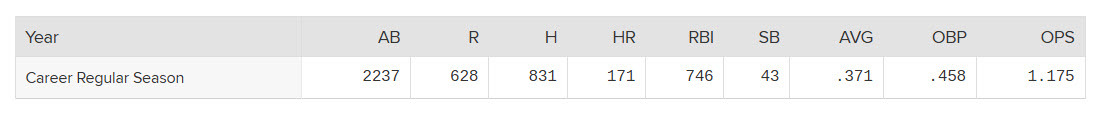
The more I got into this though, I realized that stats with percentages were more significant in determining trends. WAR tends to be the most important percentage these days and it’s relevant to both pitchers and position players, so I had to take a look.
![]()
(Calculated based on the average of bWAR and fWAR.)
The median of 83.85 WAR splits Ken Griffey Jr. (83.8) and Pedro Martinez (83.9). 31 players in the top 50 have above average WARs, while only 19 can say the same in the bottom half.
That’s a pretty significant difference that comes even further into view as we observe a combined 1,072.85 WAR above the median in the top 50 compared to a measly 335.9 WAR in the bottom 50 (and -404 in the top and -488.8 in the bottom).
What did we learn?
 As expected, this particular stat seems to be the most significant one of all. As always, there are some outliers tweaking the curve, but they tend to be Negro League players. Those particular stats offer a unique set of circumstances and if we were to exclude them the top half would trend even higher. Long story short, when we see a player with an exceptionally high WAR consistently throughout their early career, that’s surely a player whose cards are worth investing in over the long term.
Now that said, there is one final stat whose significance, I believe, will even eclipse WAR and we need look no further than Barry Bonds and Roger Clemens to see why. Their WAR towers above their peers in the bottom half of the list, so why aren’t they in the top half? Perhaps they will trend in that direction over time (just as Ty Cobb’s surly reputation hasn’t completely held him back as he sits near the top at number 4), but I suspect that public sentiment toward a player will always play a major factor. Let’s take a look…
Does Public Sentiment Drive Card Value?
This obviously isn’t a statistic tracked by MLB, so I had to get creative. Frankly, I don’t even know if my strategy is appropriate or valid, but I figured it was better than nothing. I simply looked to AI for their opinion. Gemini was initially long-winded, doing everything possible to avoid giving a specific answer, but adding a couple more sentences to create the following prompt got me the numbers I was looking for:
“On a scale of 1-10 with 10 being the highest, how would you rank public sentiment of [player name] overall as I need to understand how it affects the value of his sports cards? You can’t talk your way out of this. You have to pick a number.”
When it comes to giving opinions, AI isn’t always consistent, so I repeated the same prompt three times and recorded the average.
![]()
On a scale of 1-10 we have a median of 8.33 for players with the Top 100 highest-valued cards. Ruth, W. Johnson, Ryan, Seaver, R. Johnson, Cabrera, Betts, Judge, Winfield, and Mize all share the median. 23 of the top 50 are above the median with a cumulative of 18.74 above and -40.24 below, while 34 appear in the bottom half with a cumulative of 19.95 above and -27.61 below.
With the bottom half trending higher than the top half, it seems that public sentiment plays more of a role with more current players, while stats rise above over the long haul. So while the appeal of Bonds and Clemens cards may not be the highest right now, one could argue that collecting their cards as hand-me-downs for our grandkids might not be a bad idea.
 Ultimately, I think this is one that would require even further research - potentially even on a player-by-player basis. Consider how these players’ storylines transcend baseball:
- Jackie Robinson (7th) - First MLB player to break the color barrier.
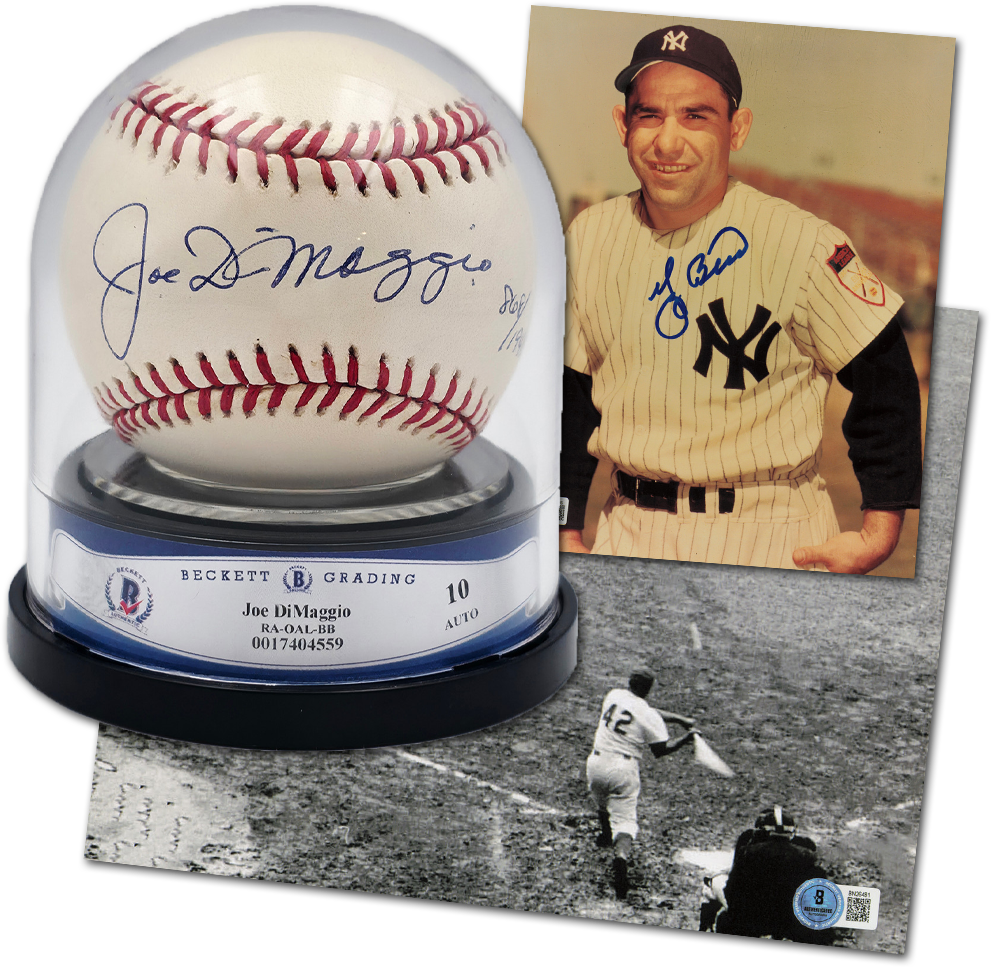
- Joe DiMaggio (12th) - Dated Marilyn Monroe and was mentioned in the timeless Simon & Garfunkel song “Mrs. Robinson”.
- Yogi Berra (29th) - Has a ton of humorous, legendary quotes known as “Yogi-isms.”
- Paul Skenes (Someday?) - Dating influencer/gymnast Livvy Dunne.
Those storylines have a cultural significance that keeps their names relevant over time and elevates them above the Public Sentiment median. It’s enough to overshadow their lower WAR and place them near the top of the entire card value list.
What did we learn?
Public Sentiment doesn’t guarantee the longevity of a player’s high card value, but it definitely needs to be taken into consideration. Each player’s story is unique.
Final Pitch
In hindsight, comparing the top and bottom of a list when the top and bottom are more accurately defined as vintage era versus modern era players is probably not the best way to seek answers to our question about which stats drive baseball card values. Fact is, vintage players at the top have seen their peers weeded out over time, yet they remain largely because of their elite stats.
Ultimately I think the entire project needs to be redone with a minimum of 1000 players. Unfortunately, that’s impossible - at least using my strategy where I took the averages of multiple Top 100 lists. There simply aren’t any Top 1000 lists to easily pull from.
Plus, I didn’t even factor in some of the card rarities in play here. Let’s be honest, it’s not WAR or Public Sentiment that delivered the top spot to Honus Wagner.
Although I soon learned that the entire project was a bit flawed due to the minimal dataset, I saw it through as it was a great opportunity for me personally to learn more about each individual player. Plus, I do still think these charts provide a unique way to observe some trends that may be at play.
As a collector, we could lean on all of the medians and simply invest in players who live on the elite side of it. For example, I tried the prompt: “Show me a list of the top 10 MLB pitchers whose careers began since 2015 and had a WPCT above .621, an ERA below 2.93, and WHIP below 1.16 through the 2024 season.” Unfortunately, the data wasn’t readily available for either Gemini or ChatGPT to answer, but with a bit more manual research, it could be. For the record, ChatGPT seemed much more capable of answering, but ultimately left me with “Tentative names that might be candidates (if verified more fully)” and mentioned Tarik Skubal and Paul Skenes.
Finally, I think we can all agree that AI isn’t always spot on with their responses so the rankings are surely open to discussion, but that’s all I was really hoping to do to begin with - drive some thought and discussion on the topic.
Anything stand out to you?
(Like why batters in AI-generated images insist on crowding the plate and what percentage of them ultimately get drilled?)